|
Download Data (XLS File) |
|
|||||
|
|||||
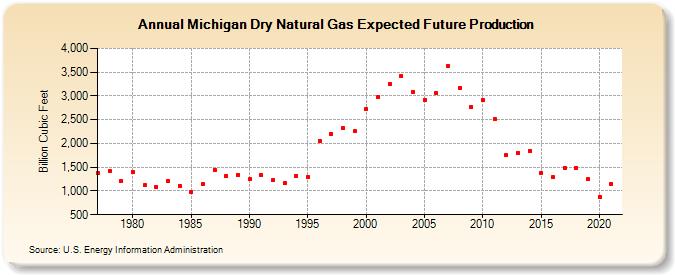
| Michigan Dry Natural Gas Expected Future Production (Billion Cubic Feet) | |||||
| Decade | Year-0 | Year-1 | Year-2 | Year-3 | Year-4 | Year-5 | Year-6 | Year-7 | Year-8 | Year-9 |
|---|---|---|---|---|---|---|---|---|---|---|
| 1970's | 1,386 | 1,422 | 1,204 | |||||||
| 1980's | 1,406 | 1,118 | 1,084 | 1,219 | 1,112 | 985 | 1,139 | 1,451 | 1,323 | 1,342 |
| 1990's | 1,243 | 1,334 | 1,223 | 1,160 | 1,323 | 1,294 | 2,061 | 2,195 | 2,328 | 2,255 |
| 2000's | 2,729 | 2,976 | 3,254 | 3,428 | 3,091 | 2,910 | 3,065 | 3,630 | 3,174 | 2,763 |
| 2010's | 2,919 | 2,505 | 1,750 | 1,807 | 1,845 | 1,386 | 1,286 | 1,489 | 1,490 | 1,245 |
| 2020's | 881 | 1,148 |
| - = No Data Reported; -- = Not Applicable; NA = Not Available; W = Withheld to avoid disclosure of individual company data. |
| Release Date: 12/30/2022 |
| Next Release Date: NA |