|
Download Data (XLS File) |
|
|||||
|
|||||
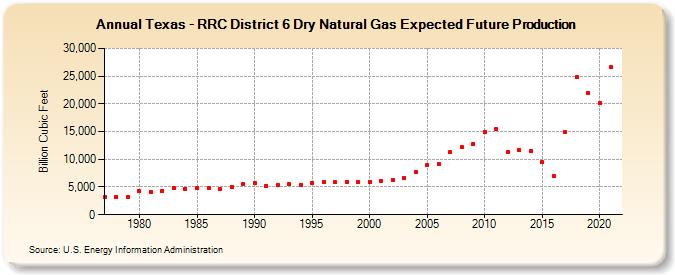
| Texas - RRC District 6 Dry Natural Gas Expected Future Production (Billion Cubic Feet) | |||||
| Decade | Year-0 | Year-1 | Year-2 | Year-3 | Year-4 | Year-5 | Year-6 | Year-7 | Year-8 | Year-9 |
|---|---|---|---|---|---|---|---|---|---|---|
| 1970's | 3,214 | 3,240 | 3,258 | |||||||
| 1980's | 4,230 | 4,177 | 4,326 | 4,857 | 4,703 | 4,822 | 4,854 | 4,682 | 4,961 | 5,614 |
| 1990's | 5,753 | 5,233 | 5,317 | 5,508 | 5,381 | 5,726 | 5,899 | 5,887 | 5,949 | 5,857 |
| 2000's | 5,976 | 6,128 | 6,256 | 6,685 | 7,638 | 8,976 | 9,087 | 11,257 | 12,184 | 12,795 |
| 2010's | 14,886 | 15,480 | 11,340 | 11,655 | 11,516 | 9,447 | 7,057 | 14,840 | 24,751 | 21,982 |
| 2020's | 20,233 | 26,603 |
| - = No Data Reported; -- = Not Applicable; NA = Not Available; W = Withheld to avoid disclosure of individual company data. |
| Release Date: 12/30/2022 |
| Next Release Date: NA |