|
Download Data (XLS File) |
|
|||||
|
|||||
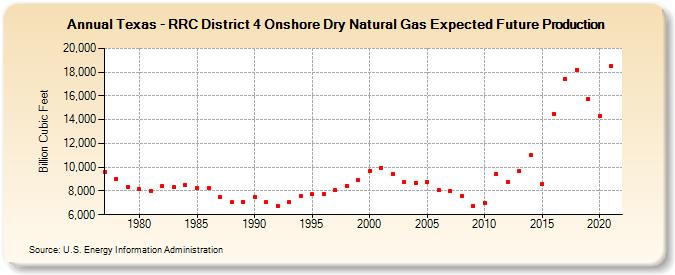
| Texas - RRC District 4 Onshore Dry Natural Gas Expected Future Production (Billion Cubic Feet) | |||||
| Decade | Year-0 | Year-1 | Year-2 | Year-3 | Year-4 | Year-5 | Year-6 | Year-7 | Year-8 | Year-9 |
|---|---|---|---|---|---|---|---|---|---|---|
| 1970's | 9,621 | 9,031 | 8,326 | |||||||
| 1980's | 8,130 | 8,004 | 8,410 | 8,316 | 8,525 | 8,250 | 8,274 | 7,490 | 7,029 | 7,111 |
| 1990's | 7,475 | 7,048 | 6,739 | 7,038 | 7,547 | 7,709 | 7,769 | 8,099 | 8,429 | 8,915 |
| 2000's | 9,645 | 9,956 | 9,469 | 8,763 | 8,699 | 8,761 | 8,116 | 7,963 | 7,604 | 6,728 |
| 2010's | 7,014 | 9,458 | 8,743 | 9,640 | 11,057 | 8,570 | 14,503 | 17,429 | 18,205 | 15,779 |
| 2020's | 14,308 | 18,545 |
| - = No Data Reported; -- = Not Applicable; NA = Not Available; W = Withheld to avoid disclosure of individual company data. |
| Release Date: 12/30/2022 |
| Next Release Date: NA |