|
Download Data (XLS File) |
|
|||||
|
|||||
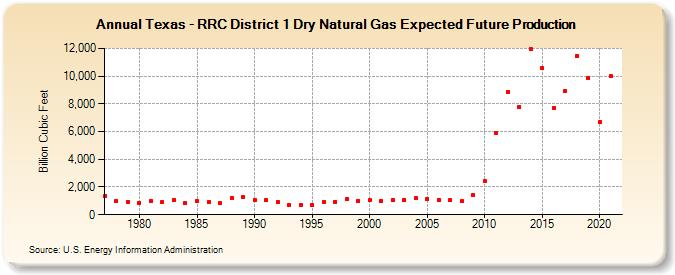
| Texas - RRC District 1 Dry Natural Gas Expected Future Production (Billion Cubic Feet) | |||||
| Decade | Year-0 | Year-1 | Year-2 | Year-3 | Year-4 | Year-5 | Year-6 | Year-7 | Year-8 | Year-9 |
|---|---|---|---|---|---|---|---|---|---|---|
| 1970's | 1,319 | 986 | 919 | |||||||
| 1980's | 829 | 1,022 | 892 | 1,087 | 838 | 967 | 913 | 812 | 1,173 | 1,267 |
| 1990's | 1,048 | 1,030 | 933 | 698 | 703 | 712 | 906 | 953 | 1,104 | 1,008 |
| 2000's | 1,032 | 1,018 | 1,045 | 1,062 | 1,184 | 1,161 | 1,063 | 1,040 | 985 | 1,398 |
| 2010's | 2,399 | 5,910 | 8,868 | 7,784 | 11,945 | 10,573 | 7,701 | 8,928 | 11,453 | 9,843 |
| 2020's | 6,701 | 9,972 |
| - = No Data Reported; -- = Not Applicable; NA = Not Available; W = Withheld to avoid disclosure of individual company data. |
| Release Date: 12/30/2022 |
| Next Release Date: NA |