|
Download Data (XLS File) |
|
|||||
|
|||||
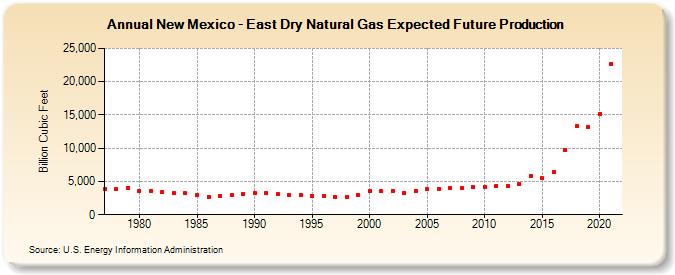
| New Mexico - East Dry Natural Gas Expected Future Production (Billion Cubic Feet) | |||||
| Decade | Year-0 | Year-1 | Year-2 | Year-3 | Year-4 | Year-5 | Year-6 | Year-7 | Year-8 | Year-9 |
|---|---|---|---|---|---|---|---|---|---|---|
| 1970's | 3,848 | 3,889 | 4,031 | |||||||
| 1980's | 3,530 | 3,598 | 3,432 | 3,230 | 3,197 | 3,034 | 2,694 | 2,881 | 2,945 | 3,075 |
| 1990's | 3,256 | 3,206 | 3,130 | 3,034 | 3,021 | 2,867 | 2,790 | 2,642 | 2,693 | 3,037 |
| 2000's | 3,537 | 3,518 | 3,632 | 3,301 | 3,621 | 3,791 | 3,914 | 3,994 | 4,031 | 4,141 |
| 2010's | 4,226 | 4,379 | 4,386 | 4,633 | 5,799 | 5,468 | 6,394 | 9,729 | 13,310 | 13,146 |
| 2020's | 15,137 | 22,699 |
| - = No Data Reported; -- = Not Applicable; NA = Not Available; W = Withheld to avoid disclosure of individual company data. |
| Release Date: 12/30/2022 |
| Next Release Date: NA |