|
Download Data (XLS File) |
|
|||||
|
|||||
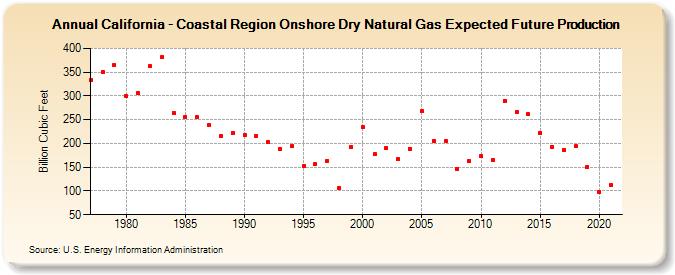
| California - Coastal Region Onshore Dry Natural Gas Expected Future Production (Billion Cubic Feet) | |||||
| Decade | Year-0 | Year-1 | Year-2 | Year-3 | Year-4 | Year-5 | Year-6 | Year-7 | Year-8 | Year-9 |
|---|---|---|---|---|---|---|---|---|---|---|
| 1970's | 334 | 350 | 365 | |||||||
| 1980's | 299 | 306 | 362 | 381 | 265 | 256 | 255 | 238 | 215 | 222 |
| 1990's | 217 | 216 | 203 | 189 | 194 | 153 | 156 | 164 | 106 | 192 |
| 2000's | 234 | 177 | 190 | 167 | 189 | 268 | 206 | 205 | 146 | 163 |
| 2010's | 173 | 165 | 290 | 266 | 261 | 223 | 193 | 187 | 194 | 150 |
| 2020's | 98 | 113 |
| - = No Data Reported; -- = Not Applicable; NA = Not Available; W = Withheld to avoid disclosure of individual company data. |
| Release Date: 12/30/2022 |
| Next Release Date: NA |