|
Download Data (XLS File) |
|
|||||
|
|||||
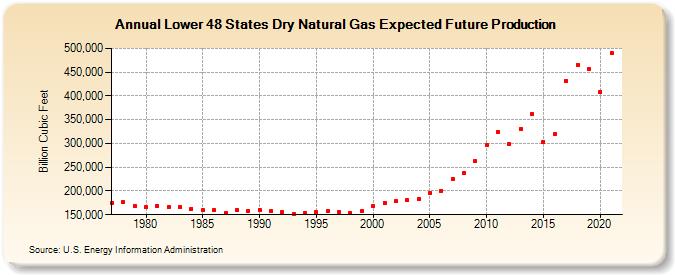
| Lower 48 States Dry Natural Gas Expected Future Production (Billion Cubic Feet) | |||||
| Decade | Year-0 | Year-1 | Year-2 | Year-3 | Year-4 | Year-5 | Year-6 | Year-7 | Year-8 | Year-9 |
|---|---|---|---|---|---|---|---|---|---|---|
| 1970's | 175,170 | 175,988 | 168,738 | |||||||
| 1980's | 165,639 | 168,693 | 166,522 | 165,964 | 162,987 | 159,522 | 158,922 | 153,986 | 158,946 | 158,177 |
| 1990's | 160,046 | 157,509 | 155,377 | 152,508 | 154,104 | 155,649 | 157,180 | 156,661 | 154,114 | 157,672 |
| 2000's | 168,190 | 174,660 | 178,478 | 180,759 | 184,106 | 196,214 | 200,840 | 225,809 | 236,957 | 263,408 |
| 2010's | 295,787 | 324,643 | 298,457 | 330,948 | 361,959 | 303,164 | 318,918 | 431,939 | 466,010 | 456,108 |
| 2020's | 409,123 | 490,395 |
| - = No Data Reported; -- = Not Applicable; NA = Not Available; W = Withheld to avoid disclosure of individual company data. |
| Release Date: 12/30/2022 |
| Next Release Date: NA |