|
Download Data (XLS File) |
|
|||||
|
|||||
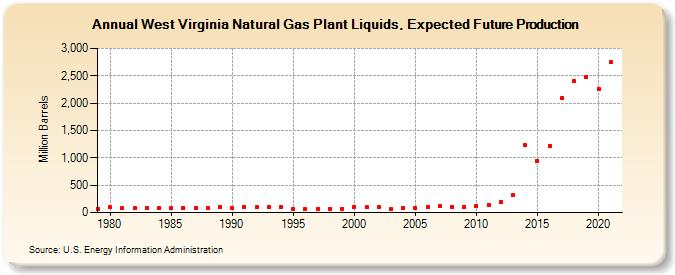
| West Virginia Natural Gas Plant Liquids, Expected Future Production (Million Barrels) | |||||
| Decade | Year-0 | Year-1 | Year-2 | Year-3 | Year-4 | Year-5 | Year-6 | Year-7 | Year-8 | Year-9 |
|---|---|---|---|---|---|---|---|---|---|---|
| 1970's | 74 | |||||||||
| 1980's | 97 | 84 | 78 | 90 | 79 | 86 | 87 | 86 | 92 | 99 |
| 1990's | 85 | 102 | 96 | 107 | 93 | 61 | 60 | 70 | 71 | 72 |
| 2000's | 104 | 105 | 98 | 67 | 84 | 84 | 109 | 114 | 97 | 108 |
| 2010's | 122 | 140 | 199 | 320 | 1,229 | 941 | 1,225 | 2,089 | 2,402 | 2,484 |
| 2020's | 2,259 | 2,745 |
| - = No Data Reported; -- = Not Applicable; NA = Not Available; W = Withheld to avoid disclosure of individual company data. |
| Release Date: 12/30/2022 |
| Next Release Date: NA |
Referring Pages: