|
Download Data (XLS File) |
|
|||||
|
|||||
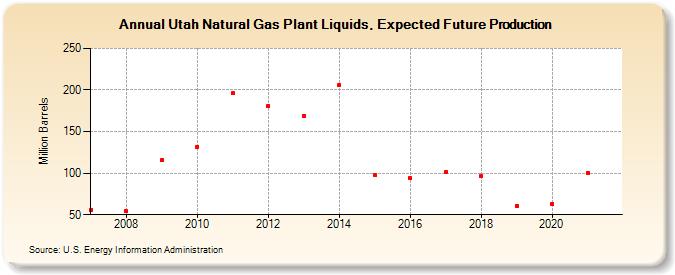
| Utah Natural Gas Plant Liquids, Expected Future Production (Million Barrels) | |||||
| Decade | Year-0 | Year-1 | Year-2 | Year-3 | Year-4 | Year-5 | Year-6 | Year-7 | Year-8 | Year-9 |
|---|---|---|---|---|---|---|---|---|---|---|
| 2000's | 56 | 54 | 116 | |||||||
| 2010's | 132 | 196 | 181 | 169 | 206 | 98 | 94 | 101 | 96 | 61 |
| 2020's | 63 | 100 |
| - = No Data Reported; -- = Not Applicable; NA = Not Available; W = Withheld to avoid disclosure of individual company data. |
| Release Date: 12/30/2022 |
| Next Release Date: NA |
Referring Pages: