|
Download Data (XLS File) |
|
|||||
|
|||||
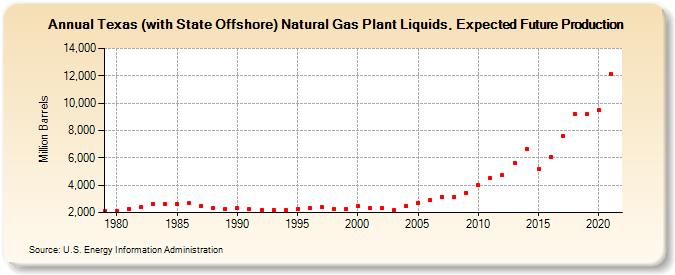
| Texas (with State Offshore) Natural Gas Plant Liquids, Expected Future Production (Million Barrels) | |||||
| Decade | Year-0 | Year-1 | Year-2 | Year-3 | Year-4 | Year-5 | Year-6 | Year-7 | Year-8 | Year-9 |
|---|---|---|---|---|---|---|---|---|---|---|
| 1970's | 2,125 | |||||||||
| 1980's | 2,081 | 2,285 | 2,393 | 2,650 | 2,660 | 2,610 | 2,671 | 2,509 | 2,339 | 2,270 |
| 1990's | 2,305 | 2,237 | 2,162 | 2,211 | 2,151 | 2,269 | 2,337 | 2,376 | 2,262 | 2,257 |
| 2000's | 2,479 | 2,318 | 2,368 | 2,192 | 2,466 | 2,723 | 2,913 | 3,158 | 3,148 | 3,432 |
| 2010's | 3,983 | 4,541 | 4,727 | 5,653 | 6,676 | 5,163 | 6,075 | 7,584 | 9,205 | 9,175 |
| 2020's | 9,467 | 12,158 |
| - = No Data Reported; -- = Not Applicable; NA = Not Available; W = Withheld to avoid disclosure of individual company data. |
| Release Date: 12/30/2022 |
| Next Release Date: NA |
Referring Pages: