|
Download Data (XLS File) |
|
|||||
|
|||||
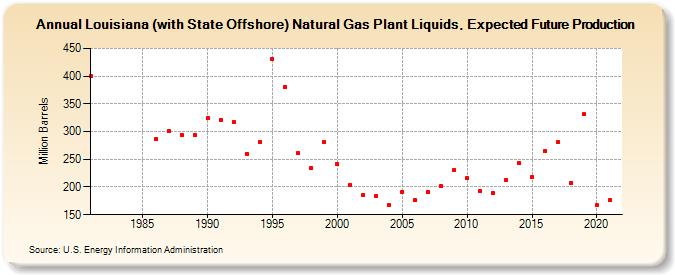
| Louisiana (with State Offshore) Natural Gas Plant Liquids, Expected Future Production (Million Barrels) | |||||
| Decade | Year-0 | Year-1 | Year-2 | Year-3 | Year-4 | Year-5 | Year-6 | Year-7 | Year-8 | Year-9 |
|---|---|---|---|---|---|---|---|---|---|---|
| 1980's | 400 | 287 | 301 | 294 | 294 | |||||
| 1990's | 324 | 321 | 317 | 260 | 281 | 430 | 381 | 261 | 234 | 281 |
| 2000's | 241 | 204 | 186 | 183 | 167 | 191 | 176 | 191 | 201 | 231 |
| 2010's | 216 | 192 | 189 | 212 | 243 | 218 | 265 | 281 | 207 | 331 |
| 2020's | 167 | 176 |
| - = No Data Reported; -- = Not Applicable; NA = Not Available; W = Withheld to avoid disclosure of individual company data. |
| Release Date: 12/30/2022 |
| Next Release Date: NA |
Referring Pages: