|
Download Data (XLS File) |
|
|||||
|
|||||
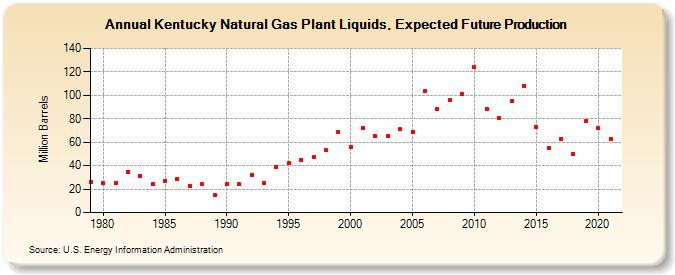
| Kentucky Natural Gas Plant Liquids, Expected Future Production (Million Barrels) | |||||
| Decade | Year-0 | Year-1 | Year-2 | Year-3 | Year-4 | Year-5 | Year-6 | Year-7 | Year-8 | Year-9 |
|---|---|---|---|---|---|---|---|---|---|---|
| 1970's | 26 | |||||||||
| 1980's | 25 | 25 | 35 | 31 | 24 | 27 | 29 | 23 | 24 | 15 |
| 1990's | 24 | 24 | 32 | 25 | 39 | 42 | 45 | 47 | 53 | 69 |
| 2000's | 56 | 72 | 65 | 65 | 71 | 69 | 104 | 88 | 96 | 101 |
| 2010's | 124 | 88 | 81 | 95 | 108 | 73 | 55 | 63 | 50 | 78 |
| 2020's | 72 | 63 |
| - = No Data Reported; -- = Not Applicable; NA = Not Available; W = Withheld to avoid disclosure of individual company data. |
| Release Date: 12/30/2022 |
| Next Release Date: NA |
Referring Pages: