|
Download Data (XLS File) |
|
|||||
|
|||||
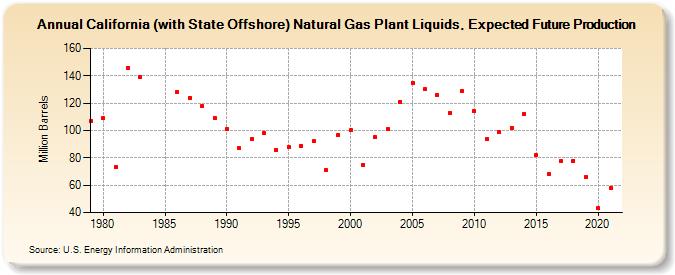
| California (with State Offshore) Natural Gas Plant Liquids, Expected Future Production (Million Barrels) | |||||
| Decade | Year-0 | Year-1 | Year-2 | Year-3 | Year-4 | Year-5 | Year-6 | Year-7 | Year-8 | Year-9 |
|---|---|---|---|---|---|---|---|---|---|---|
| 1970's | 107 | |||||||||
| 1980's | 109 | 73 | 146 | 139 | 128 | 124 | 118 | 109 | ||
| 1990's | 101 | 87 | 94 | 98 | 86 | 88 | 89 | 92 | 71 | 97 |
| 2000's | 100 | 75 | 95 | 101 | 121 | 135 | 130 | 126 | 113 | 129 |
| 2010's | 114 | 94 | 99 | 102 | 112 | 82 | 68 | 78 | 78 | 66 |
| 2020's | 43 | 58 |
| - = No Data Reported; -- = Not Applicable; NA = Not Available; W = Withheld to avoid disclosure of individual company data. |
| Release Date: 12/30/2022 |
| Next Release Date: NA |
Referring Pages: