|
Download Data (XLS File) |
|
|||||
|
|||||
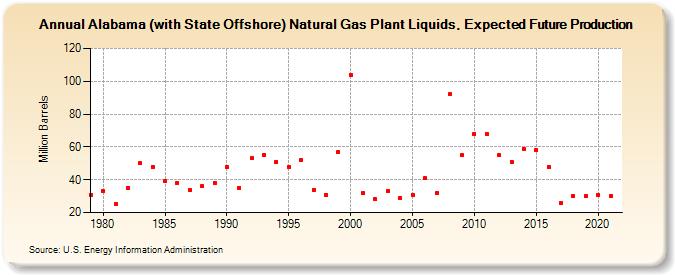
| Alabama (with State Offshore) Natural Gas Plant Liquids, Expected Future Production (Million Barrels) | |||||
| Decade | Year-0 | Year-1 | Year-2 | Year-3 | Year-4 | Year-5 | Year-6 | Year-7 | Year-8 | Year-9 |
|---|---|---|---|---|---|---|---|---|---|---|
| 1970's | 31 | |||||||||
| 1980's | 33 | 25 | 35 | 50 | 48 | 39 | 38 | 34 | 36 | 38 |
| 1990's | 48 | 35 | 53 | 55 | 51 | 48 | 52 | 34 | 31 | 57 |
| 2000's | 104 | 32 | 28 | 33 | 29 | 31 | 41 | 32 | 92 | 55 |
| 2010's | 68 | 68 | 55 | 51 | 59 | 58 | 48 | 26 | 30 | 30 |
| 2020's | 31 | 30 |
| - = No Data Reported; -- = Not Applicable; NA = Not Available; W = Withheld to avoid disclosure of individual company data. |
| Release Date: 12/30/2022 |
| Next Release Date: NA |
Referring Pages: