|
Download Data (XLS File) |
|
|||||
|
|||||
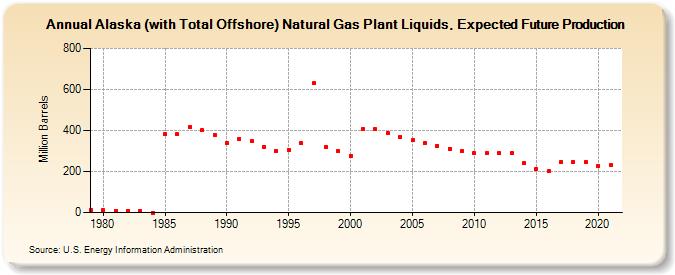
| Alaska (with Total Offshore) Natural Gas Plant Liquids, Expected Future Production (Million Barrels) | |||||
| Decade | Year-0 | Year-1 | Year-2 | Year-3 | Year-4 | Year-5 | Year-6 | Year-7 | Year-8 | Year-9 |
|---|---|---|---|---|---|---|---|---|---|---|
| 1970's | 13 | |||||||||
| 1980's | 11 | 10 | 9 | 8 | 0 | 382 | 381 | 418 | 401 | 380 |
| 1990's | 340 | 360 | 347 | 321 | 301 | 306 | 337 | 631 | 320 | 299 |
| 2000's | 277 | 405 | 405 | 387 | 369 | 352 | 338 | 325 | 312 | 299 |
| 2010's | 288 | 288 | 288 | 288 | 241 | 211 | 201 | 246 | 247 | 247 |
| 2020's | 229 | 230 |
| - = No Data Reported; -- = Not Applicable; NA = Not Available; W = Withheld to avoid disclosure of individual company data. |
| Release Date: 12/30/2022 |
| Next Release Date: NA |
Referring Pages: