|
Download Data (XLS File) |
|
|||||
|
|||||
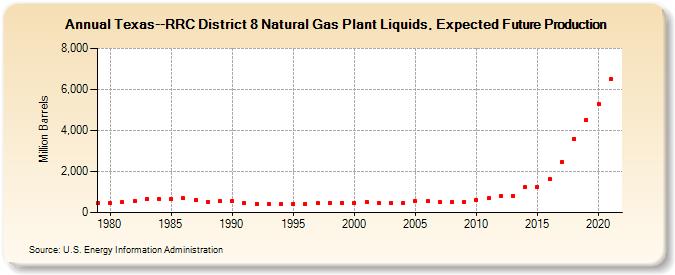
| Texas--RRC District 8 Natural Gas Plant Liquids, Expected Future Production (Million Barrels) | |||||
| Decade | Year-0 | Year-1 | Year-2 | Year-3 | Year-4 | Year-5 | Year-6 | Year-7 | Year-8 | Year-9 |
|---|---|---|---|---|---|---|---|---|---|---|
| 1970's | 452 | |||||||||
| 1980's | 452 | 498 | 554 | 650 | 662 | 646 | 697 | 623 | 530 | 542 |
| 1990's | 545 | 466 | 426 | 430 | 398 | 432 | 417 | 447 | 479 | 479 |
| 2000's | 479 | 504 | 488 | 484 | 487 | 559 | 547 | 525 | 524 | 536 |
| 2010's | 618 | 689 | 802 | 830 | 1,240 | 1,258 | 1,624 | 2,464 | 3,604 | 4,524 |
| 2020's | 5,283 | 6,495 |
| - = No Data Reported; -- = Not Applicable; NA = Not Available; W = Withheld to avoid disclosure of individual company data. |
| Release Date: 12/30/2022 |
| Next Release Date: NA |
Referring Pages: