|
Download Data (XLS File) |
|
|||||
|
|||||
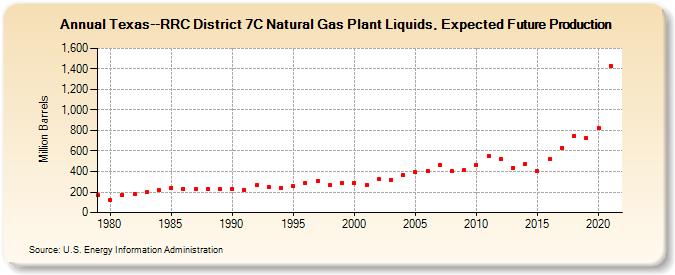
| Texas--RRC District 7C Natural Gas Plant Liquids, Expected Future Production (Million Barrels) | |||||
| Decade | Year-0 | Year-1 | Year-2 | Year-3 | Year-4 | Year-5 | Year-6 | Year-7 | Year-8 | Year-9 |
|---|---|---|---|---|---|---|---|---|---|---|
| 1970's | 168 | |||||||||
| 1980's | 120 | 172 | 184 | 204 | 219 | 242 | 232 | 231 | 226 | 225 |
| 1990's | 234 | 218 | 266 | 250 | 241 | 255 | 285 | 309 | 266 | 291 |
| 2000's | 291 | 271 | 326 | 319 | 365 | 391 | 404 | 464 | 402 | 412 |
| 2010's | 465 | 549 | 524 | 438 | 473 | 401 | 523 | 632 | 749 | 729 |
| 2020's | 822 | 1,428 |
| - = No Data Reported; -- = Not Applicable; NA = Not Available; W = Withheld to avoid disclosure of individual company data. |
| Release Date: 12/30/2022 |
| Next Release Date: NA |
Referring Pages: