|
Download Data (XLS File) |
|
|||||
|
|||||
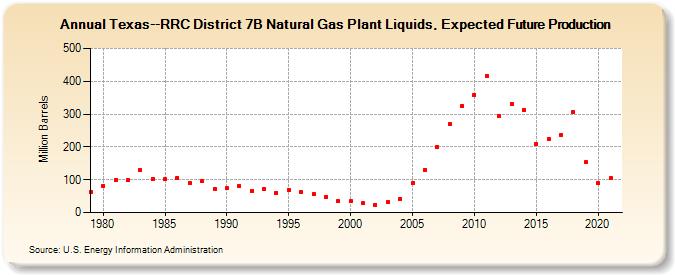
| Texas--RRC District 7B Natural Gas Plant Liquids, Expected Future Production (Million Barrels) | |||||
| Decade | Year-0 | Year-1 | Year-2 | Year-3 | Year-4 | Year-5 | Year-6 | Year-7 | Year-8 | Year-9 |
|---|---|---|---|---|---|---|---|---|---|---|
| 1970's | 62 | |||||||||
| 1980's | 82 | 99 | 99 | 129 | 103 | 101 | 106 | 90 | 95 | 71 |
| 1990's | 74 | 81 | 67 | 73 | 61 | 69 | 64 | 57 | 48 | 34 |
| 2000's | 34 | 28 | 24 | 31 | 42 | 89 | 131 | 200 | 269 | 326 |
| 2010's | 359 | 416 | 295 | 332 | 312 | 208 | 225 | 237 | 306 | 153 |
| 2020's | 89 | 104 |
| - = No Data Reported; -- = Not Applicable; NA = Not Available; W = Withheld to avoid disclosure of individual company data. |
| Release Date: 12/30/2022 |
| Next Release Date: NA |
Referring Pages: