|
Download Data (XLS File) |
|
|||||
|
|||||
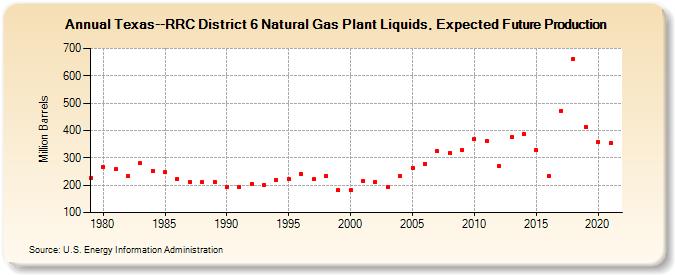
| Texas--RRC District 6 Natural Gas Plant Liquids, Expected Future Production (Million Barrels) | |||||
| Decade | Year-0 | Year-1 | Year-2 | Year-3 | Year-4 | Year-5 | Year-6 | Year-7 | Year-8 | Year-9 |
|---|---|---|---|---|---|---|---|---|---|---|
| 1970's | 228 | |||||||||
| 1980's | 268 | 259 | 232 | 280 | 253 | 247 | 224 | 213 | 210 | 212 |
| 1990's | 195 | 195 | 205 | 202 | 218 | 223 | 242 | 221 | 235 | 182 |
| 2000's | 182 | 215 | 213 | 195 | 233 | 264 | 279 | 324 | 318 | 330 |
| 2010's | 369 | 360 | 269 | 376 | 387 | 327 | 233 | 473 | 662 | 413 |
| 2020's | 359 | 354 |
| - = No Data Reported; -- = Not Applicable; NA = Not Available; W = Withheld to avoid disclosure of individual company data. |
| Release Date: 12/30/2022 |
| Next Release Date: NA |
Referring Pages: