|
Download Data (XLS File) |
|
|||||
|
|||||
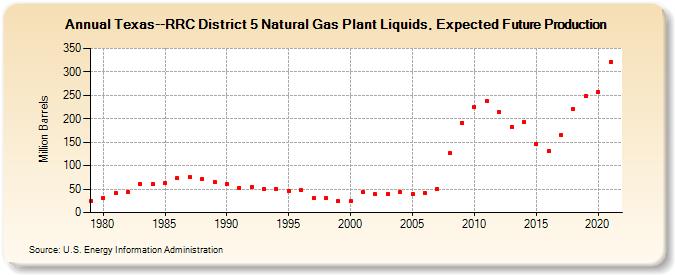
| Texas--RRC District 5 Natural Gas Plant Liquids, Expected Future Production (Million Barrels) | |||||
| Decade | Year-0 | Year-1 | Year-2 | Year-3 | Year-4 | Year-5 | Year-6 | Year-7 | Year-8 | Year-9 |
|---|---|---|---|---|---|---|---|---|---|---|
| 1970's | 24 | |||||||||
| 1980's | 32 | 42 | 44 | 61 | 61 | 62 | 73 | 76 | 72 | 65 |
| 1990's | 61 | 53 | 55 | 50 | 50 | 47 | 48 | 31 | 31 | 24 |
| 2000's | 24 | 43 | 39 | 40 | 44 | 40 | 42 | 50 | 126 | 192 |
| 2010's | 225 | 237 | 214 | 183 | 193 | 147 | 131 | 166 | 221 | 248 |
| 2020's | 258 | 322 |
| - = No Data Reported; -- = Not Applicable; NA = Not Available; W = Withheld to avoid disclosure of individual company data. |
| Release Date: 12/30/2022 |
| Next Release Date: NA |
Referring Pages: