|
Download Data (XLS File) |
|
|||||
|
|||||
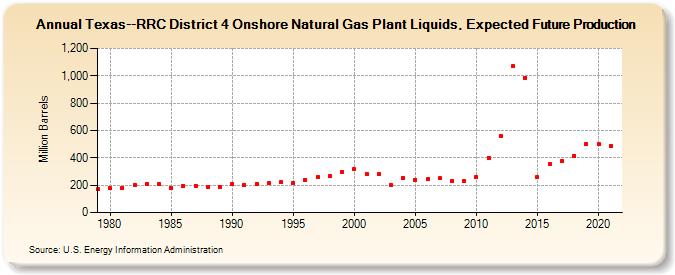
| Texas--RRC District 4 Onshore Natural Gas Plant Liquids, Expected Future Production (Million Barrels) | |||||
| Decade | Year-0 | Year-1 | Year-2 | Year-3 | Year-4 | Year-5 | Year-6 | Year-7 | Year-8 | Year-9 |
|---|---|---|---|---|---|---|---|---|---|---|
| 1970's | 172 | |||||||||
| 1980's | 177 | 183 | 204 | 212 | 208 | 183 | 197 | 197 | 186 | 188 |
| 1990's | 208 | 204 | 207 | 213 | 220 | 217 | 241 | 261 | 267 | 300 |
| 2000's | 316 | 281 | 279 | 202 | 253 | 238 | 246 | 250 | 231 | 231 |
| 2010's | 258 | 402 | 562 | 1,069 | 987 | 257 | 352 | 379 | 415 | 502 |
| 2020's | 498 | 485 |
| - = No Data Reported; -- = Not Applicable; NA = Not Available; W = Withheld to avoid disclosure of individual company data. |
| Release Date: 12/30/2022 |
| Next Release Date: NA |
Referring Pages: