|
Download Data (XLS File) |
|
|||||
|
|||||
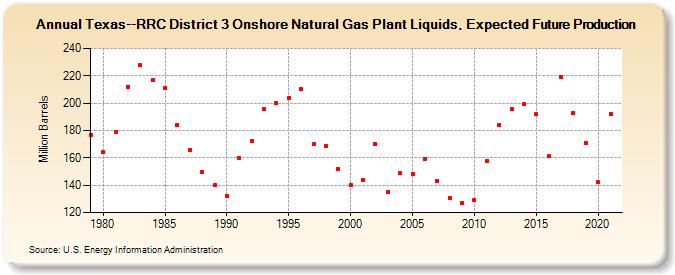
| Texas--RRC District 3 Onshore Natural Gas Plant Liquids, Expected Future Production (Million Barrels) | |||||
| Decade | Year-0 | Year-1 | Year-2 | Year-3 | Year-4 | Year-5 | Year-6 | Year-7 | Year-8 | Year-9 |
|---|---|---|---|---|---|---|---|---|---|---|
| 1970's | 177 | |||||||||
| 1980's | 164 | 179 | 212 | 228 | 217 | 211 | 184 | 166 | 150 | 140 |
| 1990's | 132 | 160 | 172 | 196 | 200 | 204 | 210 | 170 | 169 | 152 |
| 2000's | 140 | 144 | 170 | 135 | 149 | 148 | 159 | 143 | 131 | 127 |
| 2010's | 129 | 158 | 184 | 196 | 199 | 192 | 161 | 219 | 193 | 171 |
| 2020's | 142 | 192 |
| - = No Data Reported; -- = Not Applicable; NA = Not Available; W = Withheld to avoid disclosure of individual company data. |
| Release Date: 12/30/2022 |
| Next Release Date: NA |
Referring Pages: