|
Download Data (XLS File) |
|
|||||
|
|||||
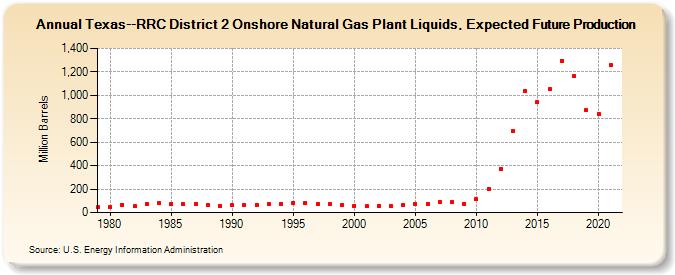
| Texas--RRC District 2 Onshore Natural Gas Plant Liquids, Expected Future Production (Million Barrels) | |||||
| Decade | Year-0 | Year-1 | Year-2 | Year-3 | Year-4 | Year-5 | Year-6 | Year-7 | Year-8 | Year-9 |
|---|---|---|---|---|---|---|---|---|---|---|
| 1970's | 45 | |||||||||
| 1980's | 48 | 68 | 52 | 73 | 81 | 76 | 69 | 70 | 67 | 56 |
| 1990's | 63 | 61 | 66 | 72 | 74 | 82 | 85 | 75 | 75 | 64 |
| 2000's | 59 | 53 | 60 | 56 | 64 | 72 | 74 | 94 | 88 | 77 |
| 2010's | 113 | 203 | 374 | 698 | 1,037 | 940 | 1,050 | 1,296 | 1,164 | 871 |
| 2020's | 840 | 1,258 |
| - = No Data Reported; -- = Not Applicable; NA = Not Available; W = Withheld to avoid disclosure of individual company data. |
| Release Date: 12/30/2022 |
| Next Release Date: NA |
Referring Pages: