|
Download Data (XLS File) |
|
|||||
|
|||||
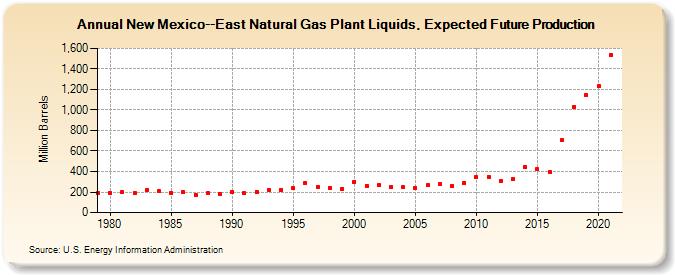
| New Mexico--East Natural Gas Plant Liquids, Expected Future Production (Million Barrels) | |||||
| Decade | Year-0 | Year-1 | Year-2 | Year-3 | Year-4 | Year-5 | Year-6 | Year-7 | Year-8 | Year-9 |
|---|---|---|---|---|---|---|---|---|---|---|
| 1970's | 192 | |||||||||
| 1980's | 192 | 197 | 193 | 216 | 206 | 192 | 200 | 176 | 193 | 179 |
| 1990's | 200 | 187 | 204 | 215 | 222 | 236 | 287 | 253 | 243 | 230 |
| 2000's | 302 | 259 | 266 | 251 | 245 | 237 | 264 | 274 | 261 | 289 |
| 2010's | 342 | 350 | 310 | 329 | 443 | 422 | 394 | 703 | 1,033 | 1,146 |
| 2020's | 1,230 | 1,534 |
| - = No Data Reported; -- = Not Applicable; NA = Not Available; W = Withheld to avoid disclosure of individual company data. |
| Release Date: 12/30/2022 |
| Next Release Date: NA |
Referring Pages: