|
Download Data (XLS File) |
|
|||||
|
|||||
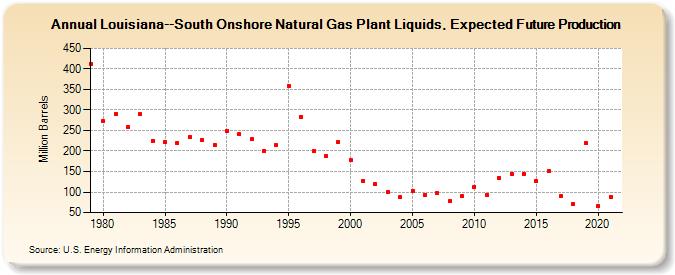
| Louisiana--South Onshore Natural Gas Plant Liquids, Expected Future Production (Million Barrels) | |||||
| Decade | Year-0 | Year-1 | Year-2 | Year-3 | Year-4 | Year-5 | Year-6 | Year-7 | Year-8 | Year-9 |
|---|---|---|---|---|---|---|---|---|---|---|
| 1970's | 413 | |||||||||
| 1980's | 273 | 291 | 258 | 289 | 225 | 222 | 220 | 235 | 228 | 215 |
| 1990's | 249 | 242 | 229 | 201 | 214 | 359 | 284 | 199 | 187 | 222 |
| 2000's | 178 | 128 | 119 | 100 | 87 | 103 | 94 | 97 | 78 | 90 |
| 2010's | 113 | 94 | 134 | 144 | 145 | 127 | 152 | 90 | 71 | 219 |
| 2020's | 66 | 89 |
| - = No Data Reported; -- = Not Applicable; NA = Not Available; W = Withheld to avoid disclosure of individual company data. |
| Release Date: 12/30/2022 |
| Next Release Date: NA |
Referring Pages: