|
Download Data (XLS File) |
|
|||||
|
|||||
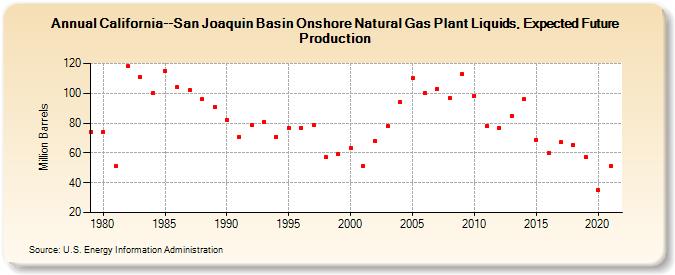
| California--San Joaquin Basin Onshore Natural Gas Plant Liquids, Expected Future Production (Million Barrels) | |||||
| Decade | Year-0 | Year-1 | Year-2 | Year-3 | Year-4 | Year-5 | Year-6 | Year-7 | Year-8 | Year-9 |
|---|---|---|---|---|---|---|---|---|---|---|
| 1970's | 74 | |||||||||
| 1980's | 74 | 51 | 118 | 111 | 100 | 115 | 104 | 102 | 96 | 91 |
| 1990's | 82 | 71 | 79 | 81 | 71 | 77 | 77 | 79 | 57 | 59 |
| 2000's | 63 | 51 | 68 | 78 | 94 | 110 | 100 | 103 | 97 | 113 |
| 2010's | 98 | 78 | 77 | 85 | 96 | 69 | 60 | 67 | 65 | 57 |
| 2020's | 35 | 51 |
| - = No Data Reported; -- = Not Applicable; NA = Not Available; W = Withheld to avoid disclosure of individual company data. |
| Release Date: 12/30/2022 |
| Next Release Date: NA |
Referring Pages: