|
Download Data (XLS File) |
|
|||||
|
|||||
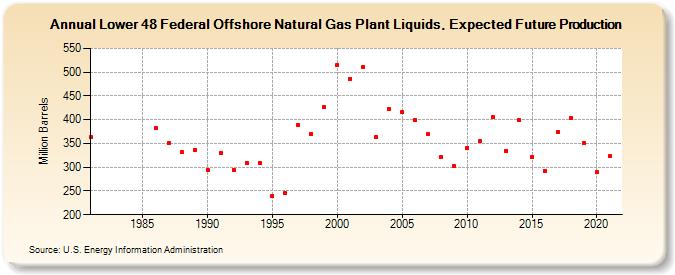
| Lower 48 Federal Offshore Natural Gas Plant Liquids, Expected Future Production (Million Barrels) | |||||
| Decade | Year-0 | Year-1 | Year-2 | Year-3 | Year-4 | Year-5 | Year-6 | Year-7 | Year-8 | Year-9 |
|---|---|---|---|---|---|---|---|---|---|---|
| 1980's | 363 | 382 | 350 | 331 | 337 | |||||
| 1990's | 295 | 329 | 295 | 309 | 309 | 239 | 245 | 389 | 370 | 427 |
| 2000's | 515 | 486 | 511 | 364 | 423 | 416 | 399 | 369 | 321 | 302 |
| 2010's | 341 | 355 | 405 | 335 | 399 | 322 | 293 | 375 | 403 | 350 |
| 2020's | 289 | 323 |
| - = No Data Reported; -- = Not Applicable; NA = Not Available; W = Withheld to avoid disclosure of individual company data. |
| Release Date: 12/30/2022 |
| Next Release Date: NA |
Referring Pages: