|
Download Data (XLS File) |
|
|||||
|
|||||
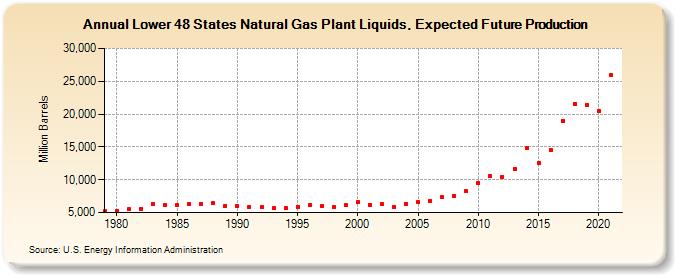
| Lower 48 States Natural Gas Plant Liquids, Expected Future Production (Million Barrels) | |||||
| Decade | Year-0 | Year-1 | Year-2 | Year-3 | Year-4 | Year-5 | Year-6 | Year-7 | Year-8 | Year-9 |
|---|---|---|---|---|---|---|---|---|---|---|
| 1970's | 5,191 | |||||||||
| 1980's | 5,187 | 5,478 | 5,611 | 6,280 | 6,121 | 6,109 | 6,348 | 6,327 | 6,448 | 6,000 |
| 1990's | 5,944 | 5,860 | 5,878 | 5,709 | 5,722 | 5,896 | 6,179 | 6,001 | 5,868 | 6,112 |
| 2000's | 6,596 | 6,190 | 6,243 | 5,857 | 6,338 | 6,551 | 6,795 | 7,323 | 7,530 | 8,258 |
| 2010's | 9,521 | 10,537 | 10,489 | 11,655 | 14,788 | 12,546 | 14,552 | 18,997 | 21,594 | 21,403 |
| 2020's | 20,466 | 25,953 |
| - = No Data Reported; -- = Not Applicable; NA = Not Available; W = Withheld to avoid disclosure of individual company data. |
| Release Date: 12/30/2022 |
| Next Release Date: NA |
Referring Pages: