|
Download Data (XLS File) |
|
|||||
|
|||||
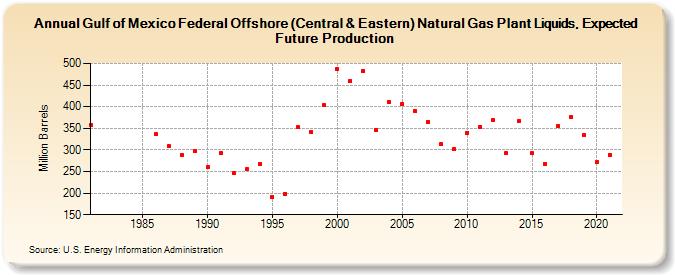
| Gulf of America Federal Offshore (Central & Eastern) Natural Gas Plant Liquids, Expected Future Production (Million Barrels) | |||||
| Decade | Year-0 | Year-1 | Year-2 | Year-3 | Year-4 | Year-5 | Year-6 | Year-7 | Year-8 | Year-9 |
|---|---|---|---|---|---|---|---|---|---|---|
| 1980's | 358 | 336 | 309 | 289 | 297 | |||||
| 1990's | 261 | 292 | 246 | 255 | 267 | 191 | 199 | 352 | 341 | 403 |
| 2000's | 487 | 460 | 483 | 347 | 410 | 407 | 390 | 365 | 313 | 301 |
| 2010's | 340 | 354 | 369 | 292 | 367 | 292 | 268 | 355 | 376 | 335 |
| 2020's | 271 | 289 |
| - = No Data Reported; -- = Not Applicable; NA = Not Available; W = Withheld to avoid disclosure of individual company data. |
| Release Date: 12/30/2022 |
| Next Release Date: NA |
Referring Pages: