|
Download Data (XLS File) |
|
|||||
|
|||||
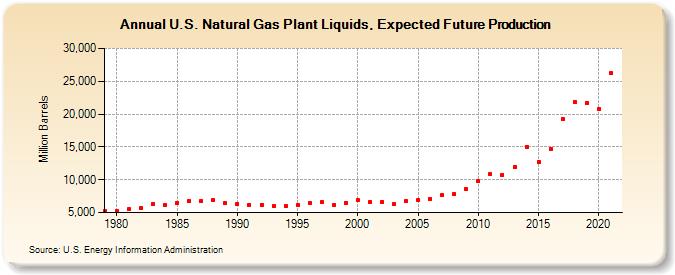
| U.S. Natural Gas Plant Liquids, Expected Future Production (Million Barrels) | |||||
| Decade | Year-0 | Year-1 | Year-2 | Year-3 | Year-4 | Year-5 | Year-6 | Year-7 | Year-8 | Year-9 |
|---|---|---|---|---|---|---|---|---|---|---|
| 1970's | 5,204 | |||||||||
| 1980's | 5,198 | 5,488 | 5,620 | 6,288 | 6,121 | 6,491 | 6,729 | 6,745 | 6,849 | 6,380 |
| 1990's | 6,284 | 6,220 | 6,225 | 6,030 | 6,023 | 6,202 | 6,516 | 6,632 | 6,188 | 6,503 |
| 2000's | 6,873 | 6,595 | 6,648 | 6,244 | 6,707 | 6,903 | 7,133 | 7,648 | 7,842 | 8,557 |
| 2010's | 9,809 | 10,825 | 10,777 | 11,943 | 15,029 | 12,757 | 14,753 | 19,243 | 21,841 | 21,650 |
| 2020's | 20,695 | 26,183 |
| - = No Data Reported; -- = Not Applicable; NA = Not Available; W = Withheld to avoid disclosure of individual company data. |
| Release Date: 12/30/2022 |
| Next Release Date: NA |
Referring Pages: