|
Download Data (XLS File) |
|
|||||
|
|||||
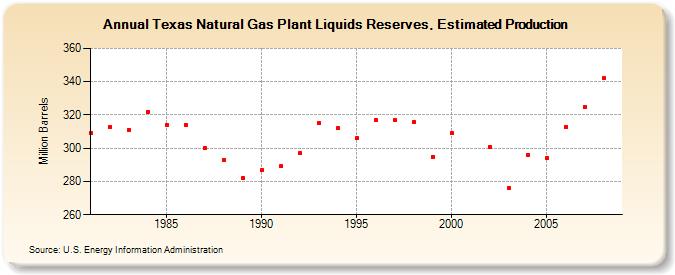
| Texas Natural Gas Plant Liquids Reserves, Estimated Production (Million Barrels) | |||||
| Decade | Year-0 | Year-1 | Year-2 | Year-3 | Year-4 | Year-5 | Year-6 | Year-7 | Year-8 | Year-9 |
|---|---|---|---|---|---|---|---|---|---|---|
| 1980's | 309 | 313 | 311 | 322 | 314 | 314 | 300 | 293 | 282 | |
| 1990's | 287 | 289 | 297 | 315 | 312 | 306 | 317 | 317 | 316 | 295 |
| 2000's | 309 | 301 | 276 | 296 | 294 | 313 | 325 | 342 |
| - = No Data Reported; -- = Not Applicable; NA = Not Available; W = Withheld to avoid disclosure of individual company data. |
| Release Date: 12/30/2022 |
| Next Release Date: NA |