|
Download Data (XLS File) |
|
|||||
|
|||||
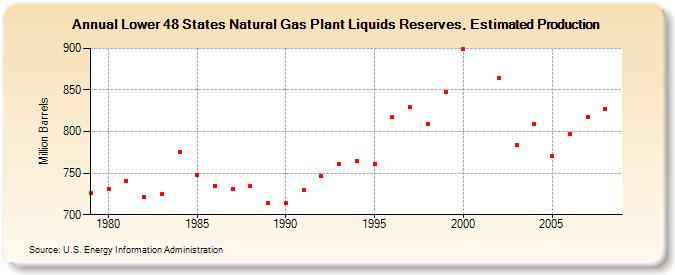
| Lower 48 States Natural Gas Plant Liquids Reserves, Estimated Production (Million Barrels) | |||||
| Decade | Year-0 | Year-1 | Year-2 | Year-3 | Year-4 | Year-5 | Year-6 | Year-7 | Year-8 | Year-9 |
|---|---|---|---|---|---|---|---|---|---|---|
| 1970's | 726 | |||||||||
| 1980's | 731 | 741 | 721 | 725 | 776 | 748 | 735 | 731 | 734 | 714 |
| 1990's | 714 | 730 | 746 | 761 | 765 | 761 | 817 | 829 | 809 | 848 |
| 2000's | 899 | 864 | 784 | 809 | 771 | 797 | 818 | 827 |
| - = No Data Reported; -- = Not Applicable; NA = Not Available; W = Withheld to avoid disclosure of individual company data. |
| Release Date: 12/30/2022 |
| Next Release Date: NA |