|
Download Data (XLS File) |
|
|||||
|
|||||
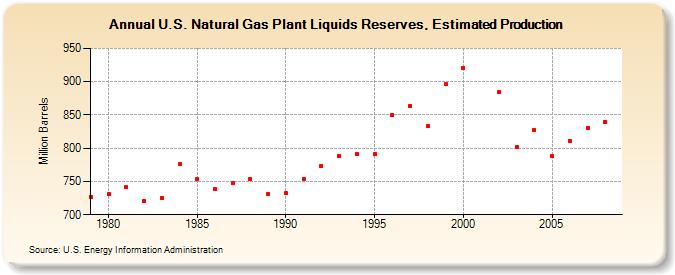
| U.S. Natural Gas Plant Liquids Reserves, Estimated Production (Million Barrels) | |||||
| Decade | Year-0 | Year-1 | Year-2 | Year-3 | Year-4 | Year-5 | Year-6 | Year-7 | Year-8 | Year-9 |
|---|---|---|---|---|---|---|---|---|---|---|
| 1970's | 727 | |||||||||
| 1980's | 731 | 741 | 721 | 725 | 776 | 753 | 738 | 747 | 754 | 731 |
| 1990's | 732 | 754 | 773 | 788 | 791 | 791 | 850 | 864 | 833 | 896 |
| 2000's | 921 | 884 | 802 | 827 | 788 | 811 | 831 | 840 |
| - = No Data Reported; -- = Not Applicable; NA = Not Available; W = Withheld to avoid disclosure of individual company data. |
| Release Date: 12/30/2022 |
| Next Release Date: NA |