|
Download Data (XLS File) |
|
|||||
|
|||||
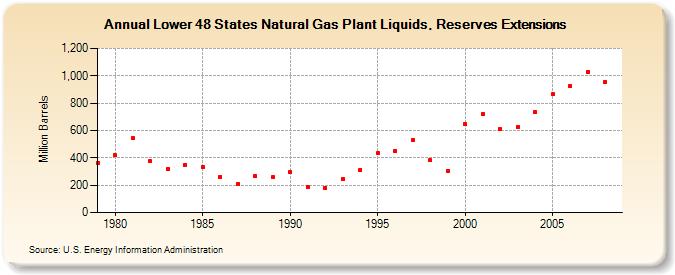
| Lower 48 States Natural Gas Plant Liquids, Reserves Extensions (Million Barrels) | |||||
| Decade | Year-0 | Year-1 | Year-2 | Year-3 | Year-4 | Year-5 | Year-6 | Year-7 | Year-8 | Year-9 |
|---|---|---|---|---|---|---|---|---|---|---|
| 1970's | 364 | |||||||||
| 1980's | 418 | 542 | 375 | 321 | 348 | 334 | 263 | 212 | 267 | 259 |
| 1990's | 298 | 187 | 183 | 245 | 314 | 432 | 450 | 533 | 383 | 304 |
| 2000's | 645 | 717 | 612 | 629 | 734 | 863 | 924 | 1,030 | 956 |
| - = No Data Reported; -- = Not Applicable; NA = Not Available; W = Withheld to avoid disclosure of individual company data. |
| Release Date: 12/30/2022 |
| Next Release Date: NA |