|
Download Data (XLS File) |
|
|||||
|
|||||
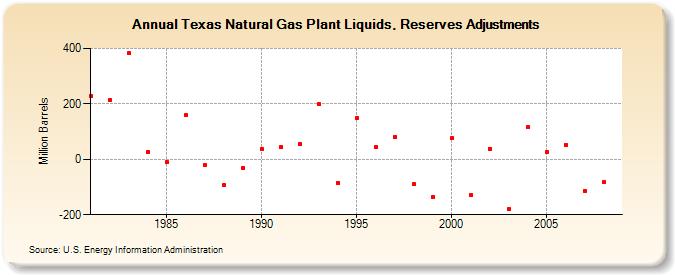
| Texas Natural Gas Plant Liquids, Reserves Adjustments (Million Barrels) | |||||
| Decade | Year-0 | Year-1 | Year-2 | Year-3 | Year-4 | Year-5 | Year-6 | Year-7 | Year-8 | Year-9 |
|---|---|---|---|---|---|---|---|---|---|---|
| 1980's | 228 | 214 | 382 | 27 | -10 | 159 | -22 | -93 | -31 | |
| 1990's | 38 | 43 | 55 | 198 | -84 | 148 | 43 | 81 | -90 | -137 |
| 2000's | 76 | -128 | 38 | -180 | 115 | 27 | 53 | -113 | -83 |
| - = No Data Reported; -- = Not Applicable; NA = Not Available; W = Withheld to avoid disclosure of individual company data. |
| Release Date: 12/30/2022 |
| Next Release Date: NA |