|
Download Data (XLS File) |
|
|||||
|
|||||
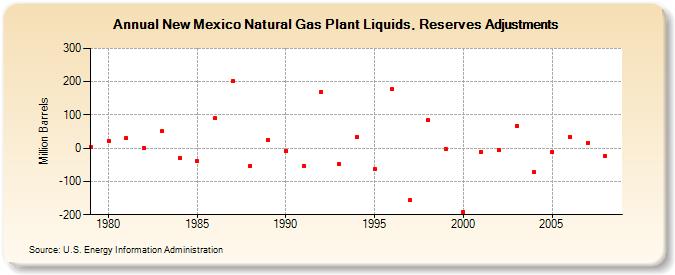
| New Mexico Natural Gas Plant Liquids, Reserves Adjustments (Million Barrels) | |||||
| Decade | Year-0 | Year-1 | Year-2 | Year-3 | Year-4 | Year-5 | Year-6 | Year-7 | Year-8 | Year-9 |
|---|---|---|---|---|---|---|---|---|---|---|
| 1970's | 4 | |||||||||
| 1980's | 23 | 31 | 0 | 51 | -30 | -40 | 90 | 202 | -53 | 26 |
| 1990's | -8 | -53 | 170 | -48 | 33 | -63 | 177 | -156 | 84 | -1 |
| 2000's | -192 | -10 | -4 | 66 | -72 | -12 | 35 | 17 | -22 |
| - = No Data Reported; -- = Not Applicable; NA = Not Available; W = Withheld to avoid disclosure of individual company data. |
| Release Date: 12/30/2022 |
| Next Release Date: NA |