|
Download Data (XLS File) |
|
|||||
|
|||||
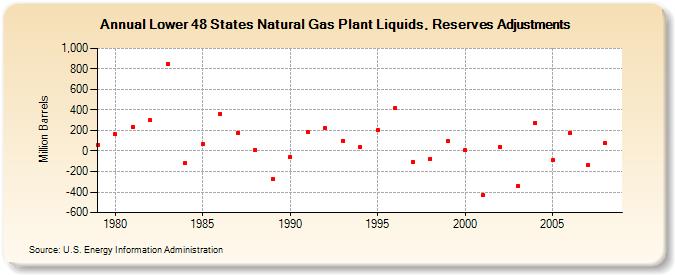
| Lower 48 States Natural Gas Plant Liquids, Reserves Adjustments (Million Barrels) | |||||
| Decade | Year-0 | Year-1 | Year-2 | Year-3 | Year-4 | Year-5 | Year-6 | Year-7 | Year-8 | Year-9 |
|---|---|---|---|---|---|---|---|---|---|---|
| 1970's | 63 | |||||||||
| 1980's | 165 | 233 | 300 | 850 | -115 | 70 | 363 | 179 | 10 | -273 |
| 1990's | -60 | 183 | 225 | 101 | 38 | 204 | 417 | -107 | -74 | 102 |
| 2000's | 9 | -429 | 42 | -338 | 273 | -89 | 173 | -139 | 76 |
| - = No Data Reported; -- = Not Applicable; NA = Not Available; W = Withheld to avoid disclosure of individual company data. |
| Release Date: 12/30/2022 |
| Next Release Date: NA |