|
Download Data (XLS File) |
|
|||||
|
|||||
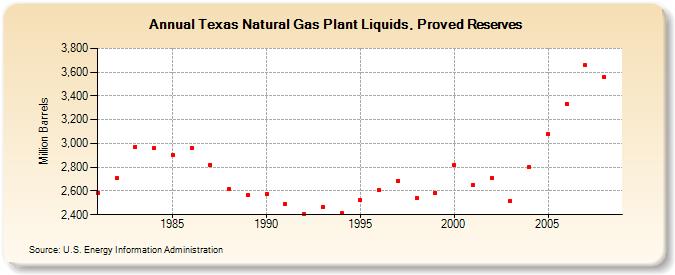
| Texas Natural Gas Plant Liquids, Proved Reserves (Million Barrels) | |||||
| Decade | Year-0 | Year-1 | Year-2 | Year-3 | Year-4 | Year-5 | Year-6 | Year-7 | Year-8 | Year-9 |
|---|---|---|---|---|---|---|---|---|---|---|
| 1980's | 2,584 | 2,705 | 2,974 | 2,960 | 2,901 | 2,964 | 2,822 | 2,617 | 2,563 | |
| 1990's | 2,575 | 2,493 | 2,402 | 2,469 | 2,414 | 2,524 | 2,606 | 2,687 | 2,544 | 2,584 |
| 2000's | 2,819 | 2,653 | 2,711 | 2,517 | 2,801 | 3,080 | 3,335 | 3,658 | 3,560 |
| - = No Data Reported; -- = Not Applicable; NA = Not Available; W = Withheld to avoid disclosure of individual company data. |
| Release Date: 12/30/2022 |
| Next Release Date: NA |