|
Download Data (XLS File) |
|
|||||
|
|||||
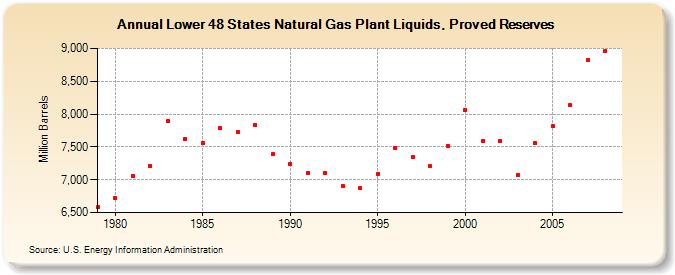
| Lower 48 States Natural Gas Plant Liquids, Proved Reserves (Million Barrels) | |||||
| Decade | Year-0 | Year-1 | Year-2 | Year-3 | Year-4 | Year-5 | Year-6 | Year-7 | Year-8 | Year-9 |
|---|---|---|---|---|---|---|---|---|---|---|
| 1970's | 6,592 | |||||||||
| 1980's | 6,717 | 7,058 | 7,212 | 7,893 | 7,624 | 7,561 | 7,784 | 7,729 | 7,837 | 7,389 |
| 1990's | 7,246 | 7,104 | 7,104 | 6,901 | 6,869 | 7,093 | 7,486 | 7,342 | 7,204 | 7,515 |
| 2000's | 8,068 | 7,588 | 7,589 | 7,072 | 7,559 | 7,813 | 8,134 | 8,818 | 8,963 |
| - = No Data Reported; -- = Not Applicable; NA = Not Available; W = Withheld to avoid disclosure of individual company data. |
| Release Date: 12/30/2022 |
| Next Release Date: NA |