|
Download Data (XLS File) |
|
|||||
|
|||||
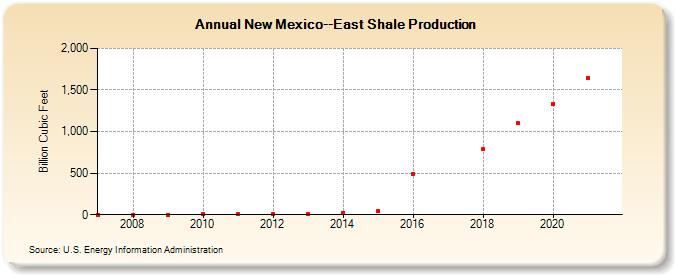
| New Mexico--East Shale Production (Billion Cubic Feet) | |||||
| Decade | Year-0 | Year-1 | Year-2 | Year-3 | Year-4 | Year-5 | Year-6 | Year-7 | Year-8 | Year-9 |
|---|---|---|---|---|---|---|---|---|---|---|
| 2000's | 2 | 0 | 1 | |||||||
| 2010's | 3 | 5 | 10 | 13 | 25 | 44 | 491 | W | 785 | 1,101 |
| 2020's | 1,337 | 1,642 |
| - = No Data Reported; -- = Not Applicable; NA = Not Available; W = Withheld to avoid disclosure of individual company data. |
| Release Date: 12/30/2022 |
| Next Release Date: NA |