|
Download Data (XLS File) |
|
|||||
|
|||||
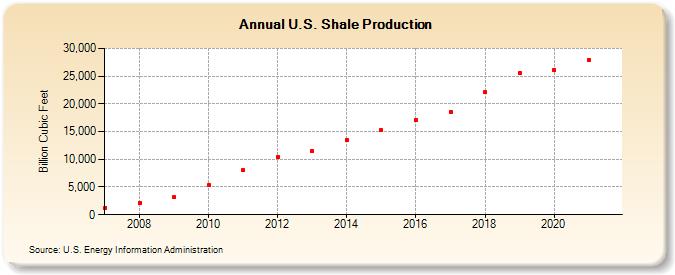
| U.S. Shale Production (Billion Cubic Feet) | |||||
| Decade | Year-0 | Year-1 | Year-2 | Year-3 | Year-4 | Year-5 | Year-6 | Year-7 | Year-8 | Year-9 |
|---|---|---|---|---|---|---|---|---|---|---|
| 2000's | 1,293 | 2,116 | 3,110 | |||||||
| 2010's | 5,336 | 7,994 | 10,371 | 11,415 | 13,447 | 15,213 | 17,032 | 18,589 | 22,054 | 25,556 |
| 2020's | 26,139 | 27,985 |
| - = No Data Reported; -- = Not Applicable; NA = Not Available; W = Withheld to avoid disclosure of individual company data. |
| Release Date: 12/30/2022 |
| Next Release Date: NA |