|
Download Data (XLS File) |
|
|||||
|
|||||
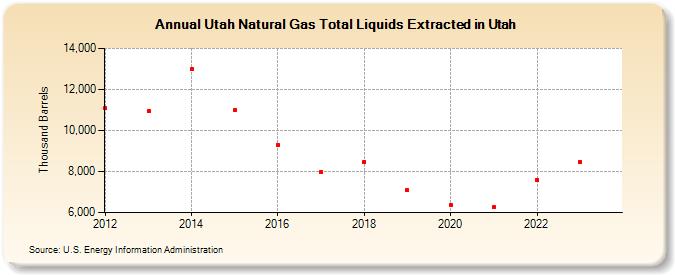
| Utah Natural Gas Total Liquids Extracted in Utah (Thousand Barrels) | |||||
| Decade | Year-0 | Year-1 | Year-2 | Year-3 | Year-4 | Year-5 | Year-6 | Year-7 | Year-8 | Year-9 |
|---|---|---|---|---|---|---|---|---|---|---|
| 2010's | 11,092 | 10,935 | 13,005 | 10,975 | 9,295 | 7,978 | 8,480 | 7,097 | ||
| 2020's | 6,375 | 6,250 | 7,579 | 8,340 | 9,016 |
| - = No Data Reported; -- = Not Applicable; NA = Not Available; W = Withheld to avoid disclosure of individual company data. |
| Release Date: 5/29/2026 |
| Next Release Date: 6/30/2026 |