|
Download Data (XLS File) |
|
|||||
|
|||||
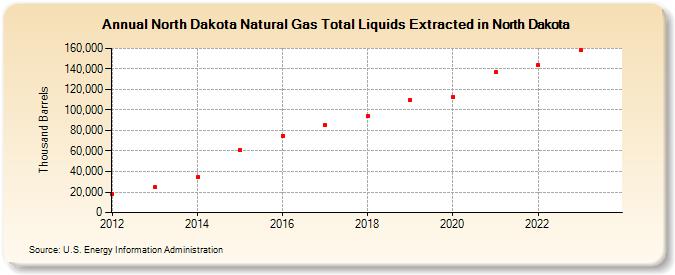
| North Dakota Natural Gas Total Liquids Extracted in North Dakota (Thousand Barrels) | |||||
| Decade | Year-0 | Year-1 | Year-2 | Year-3 | Year-4 | Year-5 | Year-6 | Year-7 | Year-8 | Year-9 |
|---|---|---|---|---|---|---|---|---|---|---|
| 2010's | 17,895 | 24,546 | 34,872 | 60,801 | 75,032 | 85,133 | 93,825 | 109,339 | ||
| 2020's | 112,764 | 136,521 | 143,757 | 158,137 | 164,975 |
| - = No Data Reported; -- = Not Applicable; NA = Not Available; W = Withheld to avoid disclosure of individual company data. |
| Release Date: 6/30/2026 |
| Next Release Date: 7/31/2026 |