|
Download Data (XLS File) |
|
|||||
|
|||||
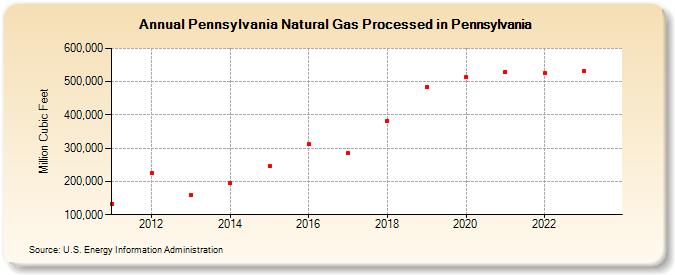
| Pennsylvania Natural Gas Processed in Pennsylvania (Million Cubic Feet) | |||||
| Decade | Year-0 | Year-1 | Year-2 | Year-3 | Year-4 | Year-5 | Year-6 | Year-7 | Year-8 | Year-9 |
|---|---|---|---|---|---|---|---|---|---|---|
| 2010's | 131,959 | 226,544 | 159,840 | 194,075 | 246,877 | 311,505 | 284,077 | 382,688 | 483,369 | |
| 2020's | 513,005 | 529,149 | 525,248 | 531,578 | 572,177 |
| - = No Data Reported; -- = Not Applicable; NA = Not Available; W = Withheld to avoid disclosure of individual company data. |
| Release Date: 6/30/2026 |
| Next Release Date: 7/31/2026 |