|
Download Data (XLS File) |
|
|||||
|
|||||
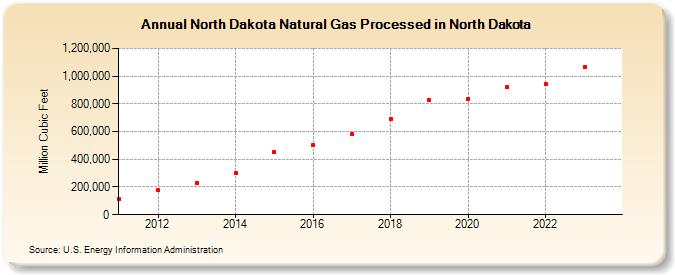
| North Dakota Natural Gas Processed in North Dakota (Million Cubic Feet) | |||||
| Decade | Year-0 | Year-1 | Year-2 | Year-3 | Year-4 | Year-5 | Year-6 | Year-7 | Year-8 | Year-9 |
|---|---|---|---|---|---|---|---|---|---|---|
| 2010's | 111,925 | 177,995 | 231,935 | 301,661 | 449,611 | 504,434 | 580,555 | 691,950 | 825,511 | |
| 2020's | 835,614 | 923,872 | 944,439 | 1,069,214 | 1,131,687 |
| - = No Data Reported; -- = Not Applicable; NA = Not Available; W = Withheld to avoid disclosure of individual company data. |
| Release Date: 6/30/2026 |
| Next Release Date: 7/31/2026 |