|
Download Data (XLS File) |
|
|||||
|
|||||
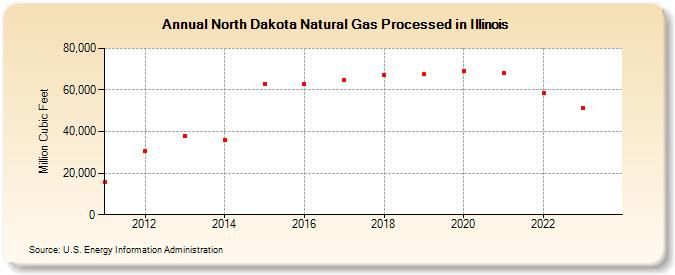
| North Dakota Natural Gas Processed in Illinois (Million Cubic Feet) | |||||
| Decade | Year-0 | Year-1 | Year-2 | Year-3 | Year-4 | Year-5 | Year-6 | Year-7 | Year-8 | Year-9 |
|---|---|---|---|---|---|---|---|---|---|---|
| 2010's | 15,727 | 30,603 | 38,066 | 35,829 | 63,073 | 62,828 | 64,859 | 67,438 | 67,649 | |
| 2020's | 68,955 | 68,351 | 58,556 | 51,459 | 38,216 |
| - = No Data Reported; -- = Not Applicable; NA = Not Available; W = Withheld to avoid disclosure of individual company data. |
| Release Date: 6/30/2026 |
| Next Release Date: 7/31/2026 |
Referring Pages: