|
Download Data (XLS File) |
|
|||||
|
|||||
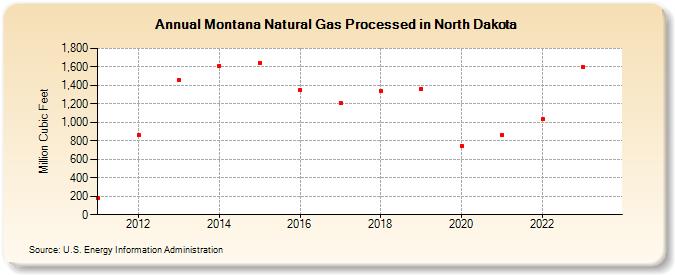
| Montana Natural Gas Processed in North Dakota (Million Cubic Feet) | |||||
| Decade | Year-0 | Year-1 | Year-2 | Year-3 | Year-4 | Year-5 | Year-6 | Year-7 | Year-8 | Year-9 |
|---|---|---|---|---|---|---|---|---|---|---|
| 2010's | 176 | 865 | 1,460 | 1,613 | 1,647 | 1,354 | 1,207 | 1,339 | 1,364 | |
| 2020's | 748 | 867 | 1,034 | 1,604 | 2,464 |
| - = No Data Reported; -- = Not Applicable; NA = Not Available; W = Withheld to avoid disclosure of individual company data. |
| Release Date: 6/30/2026 |
| Next Release Date: 7/31/2026 |
Referring Pages: