|
Download Data (XLS File) |
|
|||||
|
|||||
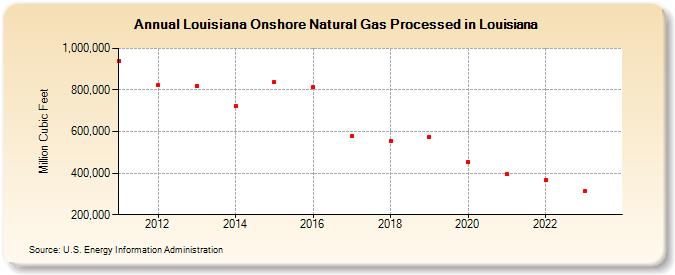
| Louisiana Onshore Natural Gas Processed in Louisiana (Million Cubic Feet) | |||||
| Decade | Year-0 | Year-1 | Year-2 | Year-3 | Year-4 | Year-5 | Year-6 | Year-7 | Year-8 | Year-9 |
|---|---|---|---|---|---|---|---|---|---|---|
| 2010's | 938,635 | 822,216 | 818,942 | 724,016 | 836,914 | 813,385 | 577,138 | 553,851 | 574,243 | |
| 2020's | 454,049 | 395,666 | 366,207 | 312,373 | 275,231 |
| - = No Data Reported; -- = Not Applicable; NA = Not Available; W = Withheld to avoid disclosure of individual company data. |
| Release Date: 6/30/2026 |
| Next Release Date: 7/31/2026 |