|
Download Data (XLS File) |
|
|||||
|
|||||
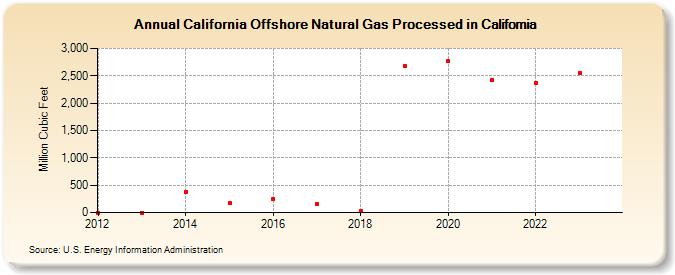
| California Offshore Natural Gas Processed in California (Million Cubic Feet) | |||||
| Decade | Year-0 | Year-1 | Year-2 | Year-3 | Year-4 | Year-5 | Year-6 | Year-7 | Year-8 | Year-9 |
|---|---|---|---|---|---|---|---|---|---|---|
| 2010's | 0 | 0 | 381 | 174 | 249 | 161 | 34 | 2,680 | ||
| 2020's | 2,771 | 2,418 | 2,364 | 2,550 | 2,131 |
| - = No Data Reported; -- = Not Applicable; NA = Not Available; W = Withheld to avoid disclosure of individual company data. |
| Release Date: 6/30/2026 |
| Next Release Date: 7/31/2026 |