|
Download Data (XLS File) |
|
|||||
|
|||||
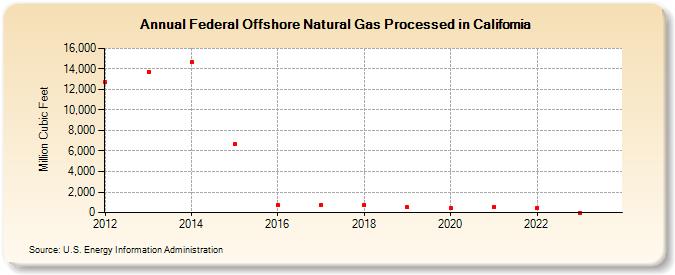
| Federal Offshore Natural Gas Processed in California (Million Cubic Feet) | |||||
| Decade | Year-0 | Year-1 | Year-2 | Year-3 | Year-4 | Year-5 | Year-6 | Year-7 | Year-8 | Year-9 |
|---|---|---|---|---|---|---|---|---|---|---|
| 2010's | 12,718 | 13,743 | 14,697 | 6,655 | 738 | 749 | 748 | 502 | ||
| 2020's | 451 | 574 | 491 | 0 | 0 |
| - = No Data Reported; -- = Not Applicable; NA = Not Available; W = Withheld to avoid disclosure of individual company data. |
| Release Date: 6/30/2026 |
| Next Release Date: 7/31/2026 |